| Prev | Next | 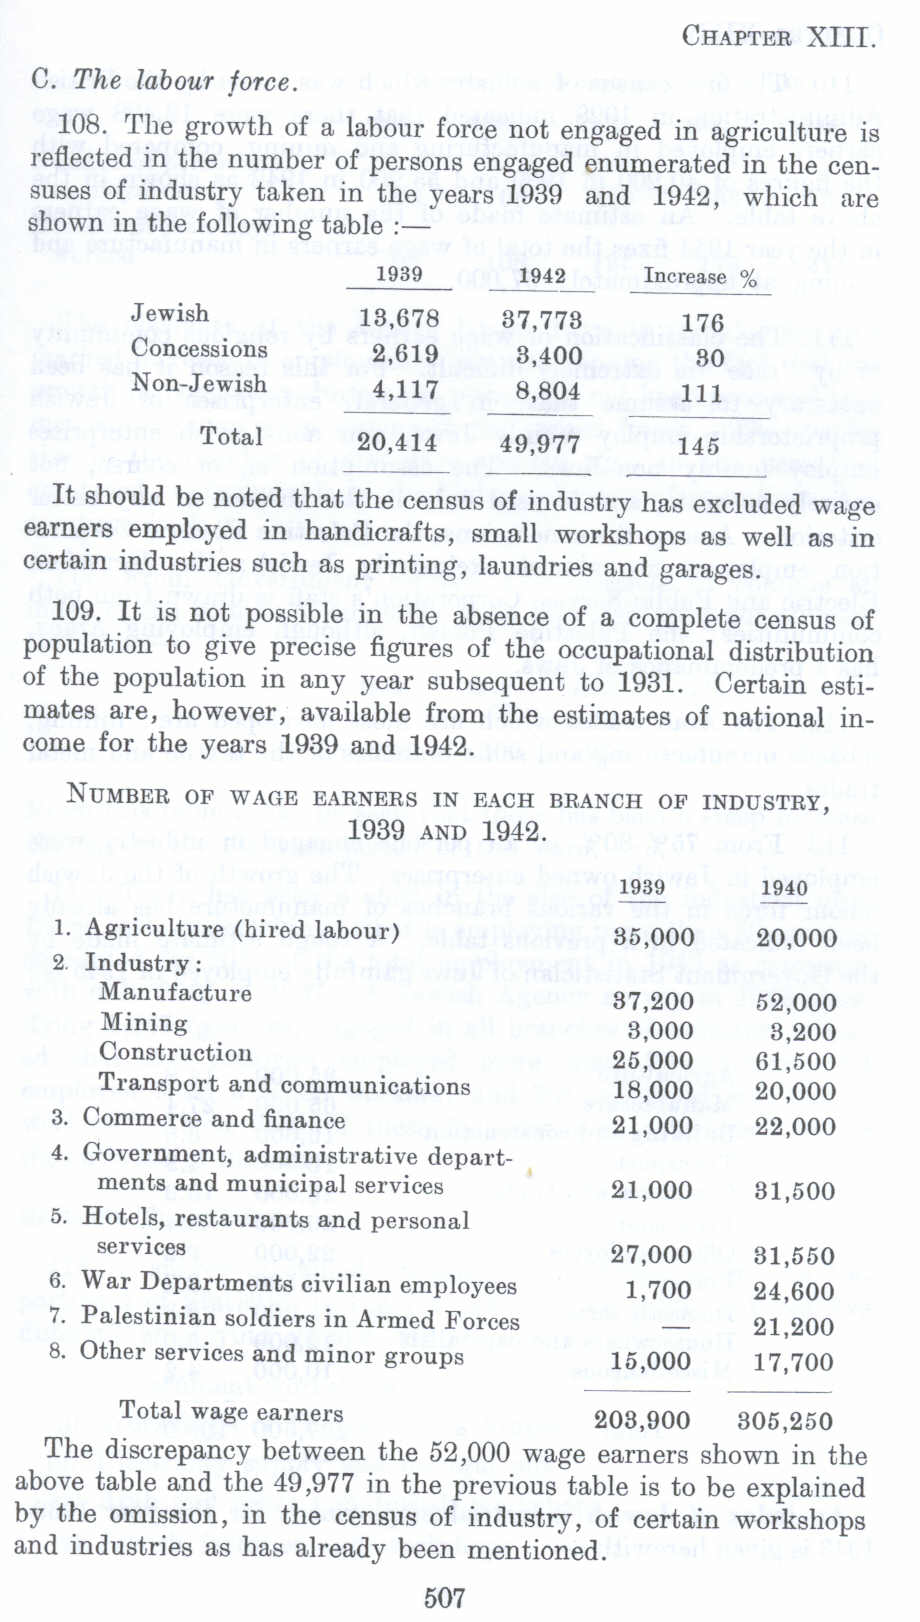 |
| Prev | Next |
| PalestineRemembered | About Us | Oral History | العربية | |
| Pictures | Zionist FAQs | Haavara | Maps | |
| Search |
| Camps |
| Districts |
| Acre |
| Baysan |
| Beersheba |
| Bethlehem |
| Gaza |
| Haifa |
| Hebron |
| Jaffa |
| Jericho |
| Jerusalem |
| Jinin |
| Nablus |
| Nazareth |
| Ramallah |
| al-Ramla |
| Safad |
| Tiberias |
| Tulkarm |
| Donate |
| Contact |
| Profile |
| Videos |
A Survey of Palestinian Industry: The Labor Force before 1948 (Nakba). NUMBER OF WAGE EARNERS IN EACH BRANCH OF INDUSTRY, 1939 AND 1942 before Nakba. British Mandate: A Survey of Palestine: Volume I - Page 507. Chapter XIII: Section 4 |
Disclaimer
The above documents, article, interviews, movies, podcasts, or stories reflects solely the research and opinions of its authors. PalestineRemembered.com makes its best effort to validate its contents.
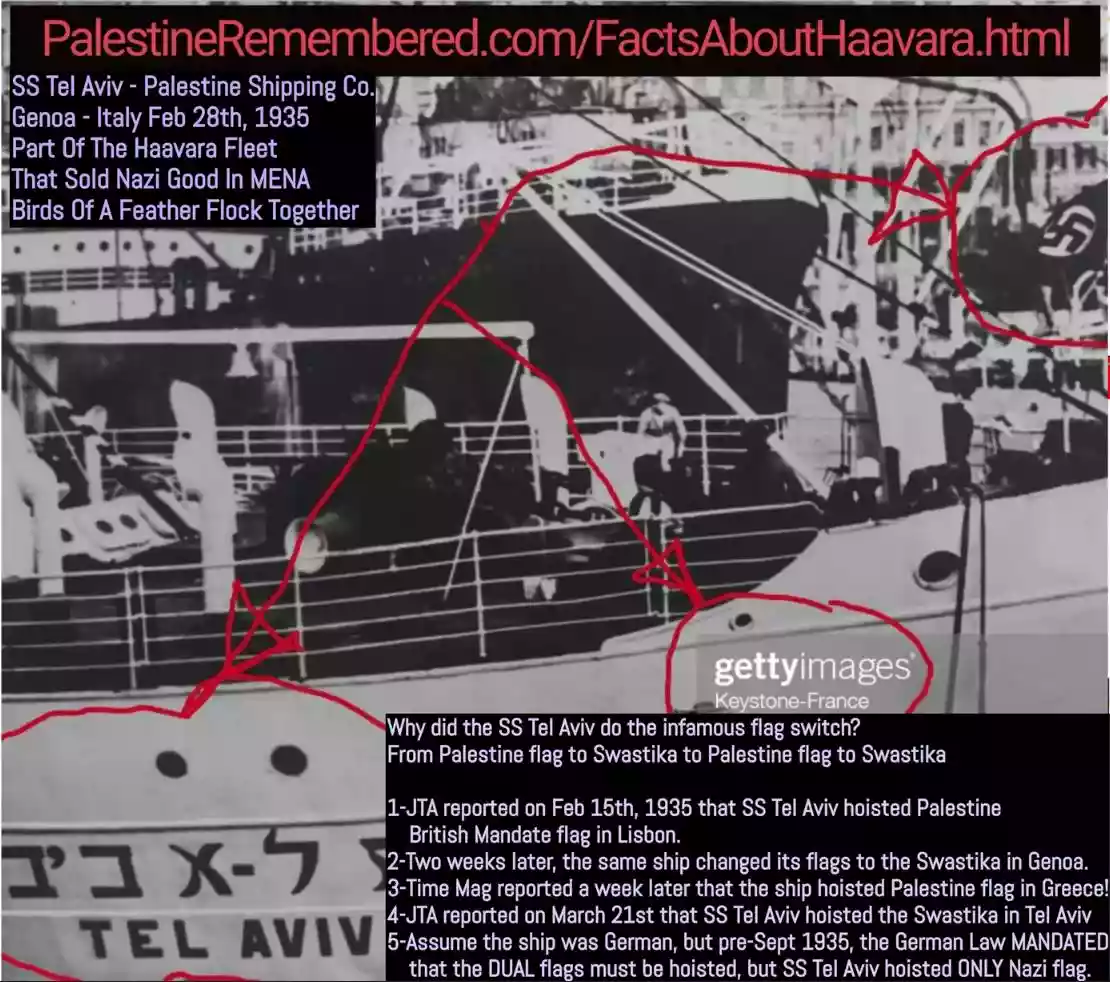 Fake Valor: Why Did Zionist Jews Hoist Nazis Flag on Their Ships in the 1930s?
What is new?
-
Facts About Oct. 7th Gaza Raid

-
Remined Us Please: Who Did Rape Whom? Was it Palestinians who raped Israelis? Or, was the other way around? You'll be the judge
-
When Prof. Edward Said was invited to debate Bibi Netanyahu in the 1980s, watch what happened!
-
Ezra Klein of the NY Times on the "Jewish Race".
-
Abusing Blood Libel!
-
How and why Israeli Jewry has become the most hated cult?
-
Did Israeli Soldiers Activate The Hannibal Direective On Oct. 7th? You Be The Judge
-
Zionist FAQ: Isn't it true that Palestinians don't want peace? Palestinians never accepted the two-state solution
- Facts about Haavara (Transfer) Agreement between Ben-Gurion & Hitler
-
Haavara FAQs: Why Did Zionist Jews Hoist Nazis' Flags on Their Ships in the 1930s?
- Haavara FAQs: When Chaim Weizmann met FDR in mid-1943, why was he silent about rescuing European Jewry?
-
Dear ChatGPT: How did Palestinians resist Napoleon's invasion of their country in 1799?
-
Dear ChatGPT: Gaza had a vibrant Jewish community in the mid-17th century. What happened to them?
-
Dear ChatGPT: Why did the Jewish Agency suppress news of the Holocaust during WWII?
-
Video Playlist: Jews share their DNA tests to end the conflict for good.
-
A Tale of Two Conflicts: Examining the Definition of Genocide
-
Prof. Abraham Polak And The Suppressed History of the Khazars and European Jewry
-
How Ronald Reagan would have framed the genocide in Gaza if he were still alive?
-
Haavara FAQs: Let us do the math: how many German Jews did The Haavara Agreement save?
-
Zionist FAQs: The Hebron Massacre of 1929, "clearly proves" that Palestinians are antisemitic, how could you deny it?
-
Zionist FAQs: Why Anti-Zionist Is Not Antisemitism?
-
Zionist FAQs: Isn't it true that the KGB created Palestinian Nationalism in the early 1960s?
- Zionist FAQs: Muslims are killing Muslims all the time; why are Israeli Jews being singled out in the media?
- Zionist FAQs: How is Israel an apartheid state when 20% of its citizens are Arabs who enjoy full rights?
-
Haavara FAQs: Why Did Dorothy Thompson Flip From A Zionist Advocate to A Silenced Dissenter?
-
Haavara FAQs: Analysis of Herzl's Uganda Scheme and how it could have saved millions of Jews.
-
Haavara FAQs: Why did Hayim Greenberg describe American Jewry as "morally bankrupt" in early 1943?
-
Haavara FAQs: What if the Evian Conference was a resounding success? What would have been the impact of saving European Jewry on Zionism?
- Haavara FAQs: What if the six million were saved, how that would have impacted the Zionist project?
-
Haavara FAQs: How did Zionist leaders react when Europe's Jews lingered in the DP camps after WWII ended?
-
Why does the American Jewish community repeat lies that David Ben-Gurion had debunked before he died?
-
Who has the power to rename the Tatar/Khazar Gene Marker to Jewish IV?
-
Zionist FAQs: Why won't Egypt, Syria, and Jordan take their people back? Jews are indigenous to Palestine, and Arabs immigrated after Jews developed the country. Arabs should leave.
-
Haavara FAQs: Did Hitler and the Nazis conflate between Judaism and Zionist? If that wasn't case, then why?
-
Haavara FAQs: Winston Churchill and antisemitism, a collection of articles written Churchill.
-
Haavara FAQs: Broken by country, how many Jews survived vs. killed during the Holocaust?
-
Haavara FAQs: Why did European Jews vote with their feet and to immigrated to the Americas, not Palestine, after WWII?
-
Watch this American Jewish Girl describing Israeli Jews' cognitive dissonance like no other in under two minutes
-
Haavara FAQs: When the Nazis went out of their way to hide the Holocaust, Israeli Jews did the exact opposite by broadcasting their genocide of Gazans. But why?
-
Haavara FAQs: How Zionist Jews went out of their to show their appreciation to Nazism and Fascism?
- Haavara FAQs: Why Zionist leaders were against bombing the death camps & the Railroads leading to them?
-
Haavara FAQs: Hitler's message to the British and American people: If Jews are such noble citizens and you care about them, how come you're not letting them in? I will gladly ship them to you at my expense, even on luxury liners!
-
A shortlist of Zionist and Israeli false flag operations in the name Jews.
-
The Most Moral Army
- The Land of Kapos (Israel): Where the brave are boycotted and Kapos walk free.
- Why did early Zionists often named their communal enterprises "colonial"?
- Zionist Relations with Nazi Germany by Faris Glubb
-
Two NY Times advertisements by Zionists in the early 1943 that exposes Zionists' treason at the height of the calamity
- Facts Not Lies about the Palestinian-Israeli Conflict.
- Site's pictures have been categorized
- Campgain Against Lice
- A Survey of Palestine, the official source about Palestine before Nakba produced by the British Mandate; over 1200 pages.
- Satellite View & Google Earth: Over 6,000 placemarks identifying all destroyed towns, W. Bank & Gaza Strip Towns, & refugee camps.
- PalestineRemembered.com and its Nakba Oral History Project were featured on al-Jazeera Satellite TV.
- Nakba Oral History Video Podcast:
 Over 700 Oral History interviews (including 3,500+ hours of recording) can be viewed online.
 - Palestine Village Statistics Project
- Gaza Jail Break
- النسخة العربية للموقع الان متوفرة
- Videos: Documenting the destroyed villages in video: Tracing all that remains since Nakba.
- Videos: Responding to Zionist Propaganda
- Interview: The ethnic cleansing of Palestine: George Galloway interviews Israeli Historian Ilan Pappe.
- For Palestinians, memory matters. It provides a blueprint for their future By George Bisharat.
- Zionist FAQ now available in Hebrew שאלות שציונים שואלים, עכשיו בעברית
- Video: The Stephen Walt and John Mearsheimer report on the influence of the Israel Lobby on U.S. Foreign Policy
- The Palestinian-Israeli conflict for beginners

Post Your Comment
*It should be NOTED that your email address won't be shared, and all communications between members will be routed via the website's mail server.
C. The labour force.
108. The growth of a labour force not engaged in agriculture is reflected in the number of persons engaged enumerated in the censuses of industry taken in the years 1939 and 1942, which are shown in the following table :-
1939 1942 Increase %
Jewish 13,678 37,778 176
Concessions 2,619 3,400 30
Non-Jewish 4,117 8,804 111
--- --- ---
Total 20,414 49,977 145 It should be noted that the census of industry has excluded wage earners employed in handicrafts, small workshops as well as in certain industries such as printing, laundries and garages.
109. It is not possible in the absence of a complete census of population to give precise figures of the occupational distribution of the population in any year subsequent to 1931. Certain estimates are, however, available from the estimates of national income for the years 1939 and 1942.
NUMBER OF WAGE EARNERS IN EACH BRANCH OF INDUSTRY, 1939 AND 1942.
1939 1940
l. Agriculture (hired labour) 35,000 20,000
2. Industry:
Manufacture 87,200 52,000
Mining 8,000 8,200
Construction 25,000 61,500
Transport and communications 18,000 20,000
3. Commerce and finance 21,000 22,000
4. Government, administrative departments and municipal services 21,000 81,500
5. Hotels, restaurants and personal
services 27,000 31,550
6. War Departments civilian employees 1,700 24,600
7. Palestinian soldiers in Armed Forces - 21,200
8. Other services and minor groups 15,000 17,700 Total wage earners 208,900 305,250
The discrepancy between the 52,000 wage earners shown in the above table and the 49,977 in the previous table is to be explained by the omission, in the census of industry, of certain workshops and industries as has already been mentioned.
Page 507