| Prev | Next |  |
| Prev | Next |
| PalestineRemembered | About Us | Oral History | العربية | |
| Pictures | Zionist FAQs | Haavara | Maps | |
| Search |
| Camps |
| Districts |
| Acre |
| Baysan |
| Beersheba |
| Bethlehem |
| Gaza |
| Haifa |
| Hebron |
| Jaffa |
| Jericho |
| Jerusalem |
| Jinin |
| Nablus |
| Nazareth |
| Ramallah |
| al-Ramla |
| Safad |
| Tiberias |
| Tulkarm |
| Donate |
| Contact |
| Profile |
| Videos |
British Mandate: A Survey of Palestine: Volume I - Page 532. Chapter XIII: Section 4: A Survey of Industry: Statistics Relating to Building Permits And Approximate Value Declared, 1939 - 44 |
Disclaimer
The above documents, article, interviews, movies, podcasts, or stories reflects solely the research and opinions of its authors. PalestineRemembered.com makes its best effort to validate its contents.


Post Your Comment
*It should be NOTED that your email address won't be shared, and all communications between members will be routed via the website's mail server.
industry in the strict sense, its role in the country's economy has been of such importance and its activities so intimately associated with industry that some indication of building activity particularly in urban areas is of interest.
Construction has flactuated in relation with the volume of immigration. In recent years war-time circumstances have imposed a serious restriction on the trade and have resulted in a considerable accumulated demand for both domestic and industrial construction.
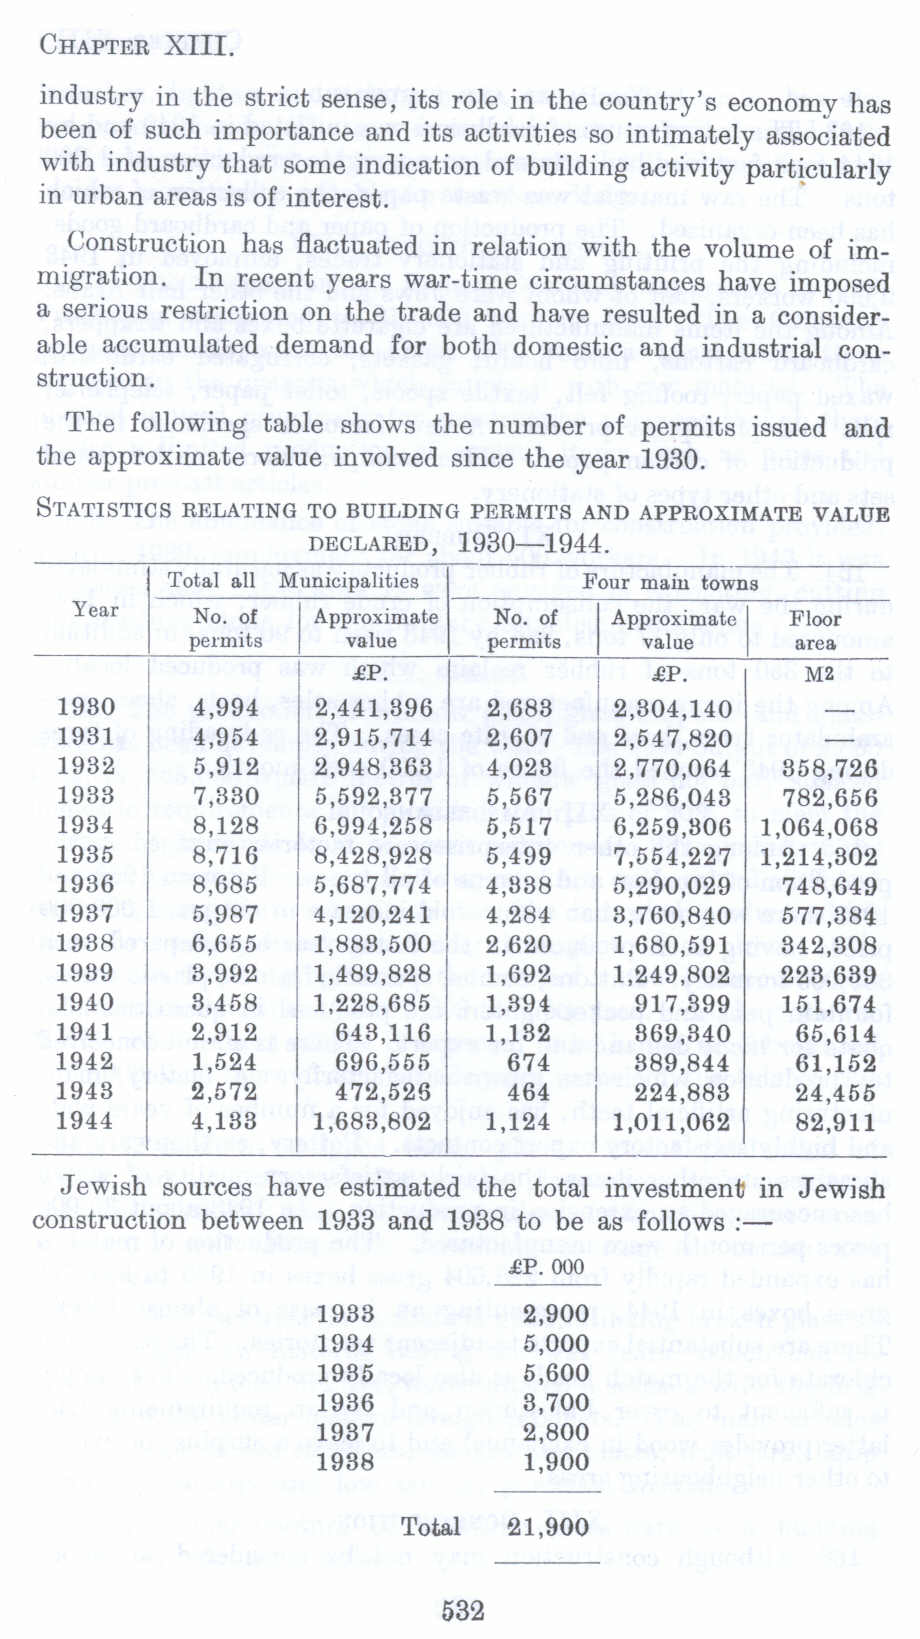
The following table shows the number of permits issued and the approximate value involved since the year 1930.
STATISTICS RELATING TO BUILDING PERMITS AND APPROXIMATE VALUE DECLARED, 1930-1944.
Total all Municipalities Four main towns
Year No. of I Approximate No. of [ Approximate l Floor
permits value permits value area.
£P. I £P. M2
1930 4,994 2,441,396 2,683 2,304,140 -
1931 4,954 2,915,714 2,607 2,547,820 -
1932 5,912 2,948,363 4,023 2,770,064 358,726
1933 7,330 5,592,377 5,567 5,286,043 782,656
1934 8,128 6,994,258 5,517 6,259,806 1,064,068
1935 8,716 8,428,928 5,499 7,554,227 1,214,302
1936 8,685 5,687,774 4,338 5,290,029 748,649
1937 5,987 4,120,241 4,284 3,760,840 577,384
1938 6,655 1,883,500 2,620 1,680,591 342,308
1939 3,992 1,489,828 1,692 1,249,802 223,639
1940 3,458 1,228,685 1,394 917,399 151,674
1941 2,912 643,116 1,132 369,340 65,614
1942 1,524 696,555 674 389,844 61,152
1943 2,572 I 472.526 464 I 224.883 24,455
1944 4,133 1,683,802 1,124 1,Ql l ,062 82,911
Jewish sources have estimated the total investment in Jewish construction between 1933 and 1938 to be as follows :-
£P. 000
1933 1934 1935 1936 1937 1938
2,900 5,000 5,600 3,700 2,800 1,900
Total
21,900
Page 532