| Prev | Next |  |
| Prev | Next |
| PalestineRemembered | About Us | Oral History | العربية | |
| Pictures | Zionist FAQs | Haavara | Maps | |
| Search |
| Camps |
| Districts |
| Acre |
| Baysan |
| Beersheba |
| Bethlehem |
| Gaza |
| Haifa |
| Hebron |
| Jaffa |
| Jericho |
| Jerusalem |
| Jinin |
| Nablus |
| Nazareth |
| Ramallah |
| al-Ramla |
| Safad |
| Tiberias |
| Tulkarm |
| Donate |
| Contact |
| Profile |
| Videos |
British Mandate: A Survey of Palestine: Volume II - Page 692 |
Disclaimer
The above documents, article, interviews, movies, podcasts, or stories reflects solely the research and opinions of its authors. PalestineRemembered.com makes its best effort to validate its contents.


Post Your Comment
*It should be NOTED that your email address won't be shared, and all communications between members will be routed via the website's mail server.
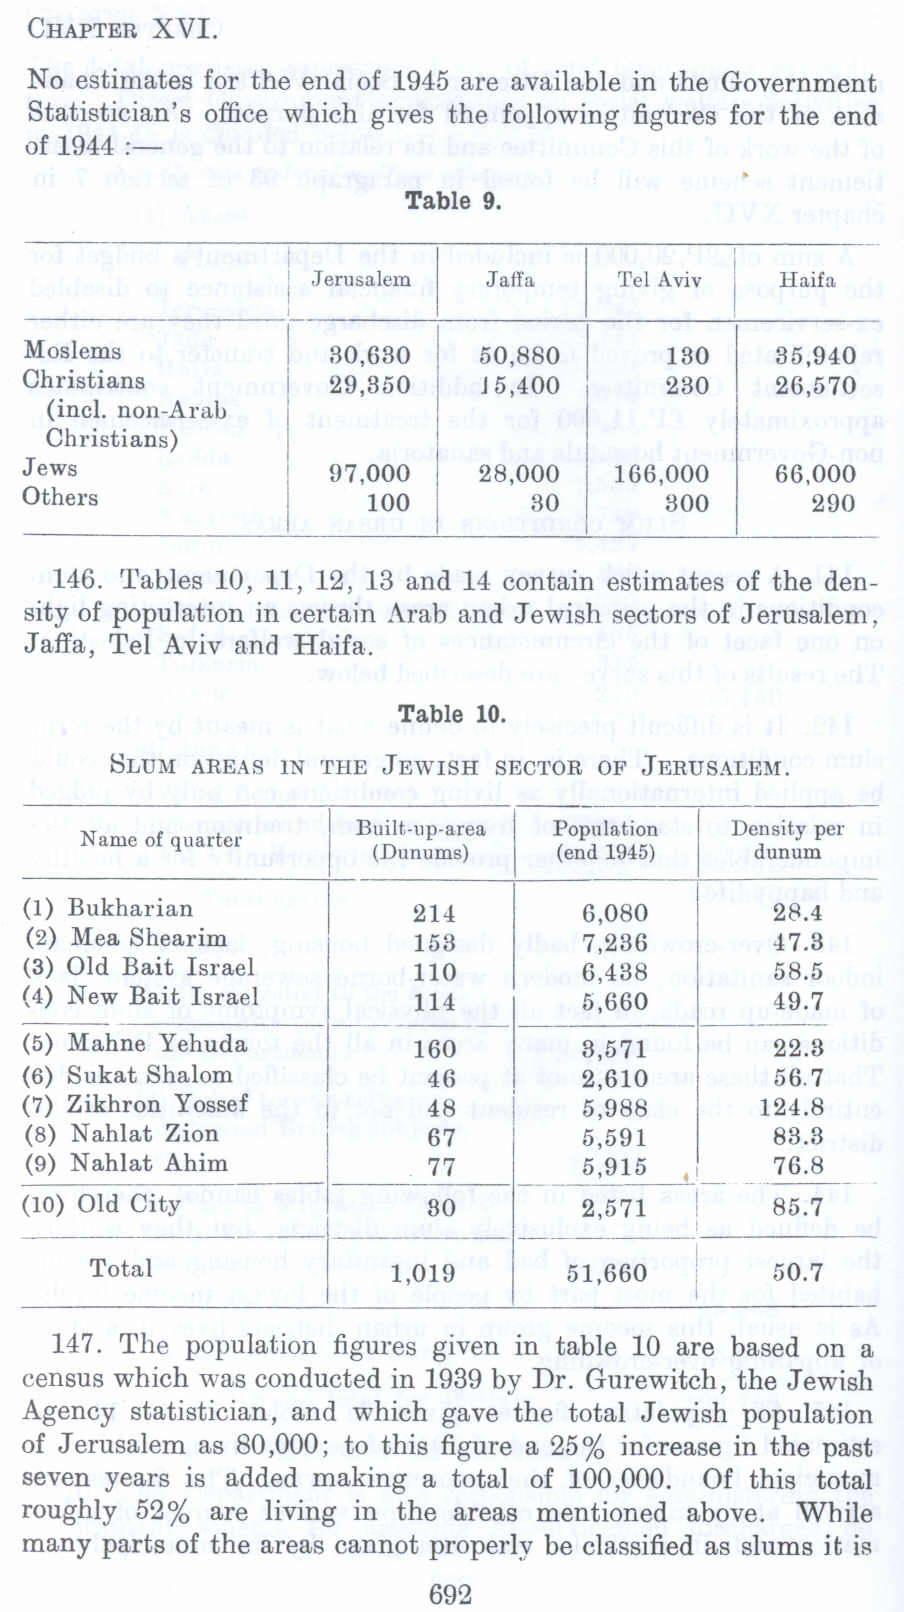
No estimates for the end of 1945 are available in the Government Statistician's office which gives the following figures for the end of 1944 :-
Table 9.
Jerusalem I Jaffa I Tel Aviv I Haifa
MosIems I 30,G30 I 50,880 I ISO I 35,940
Christians I 29,350 J 5,400 I 230 26,570
(incl. non-Arab
Christians)
Jews 97,000 I 28,000 166,000 66.000
Others 100 30 300 290 146. Tables 10, 11, 12, 13 and 14 contain estimates of the density of population in certain Arab and Jewish sectors of Jerusalem, Jaffa, Tel Aviv and Haifa.
Table 10.
SLUM AREAS IN THE JEWISH SECTOR OF JERUSALEM
Name of quarter I Built-up-area I Population I Density per
(Dunums) (end 1945) dun um
(I) Bukharian 214 6,080 28.4
(2) Mea Shearim 153 7,286 47.S
(3) Old Bait Israel 110 G,438 58.5
(4) New Bait Israel 114 5,660 49.7
(5) Mahoe Yehuda 160 3,571 22.3
(6) Sukat Shalom 46 2,610 56 7
(7) Zikhron Yossef I 48 5,988 124.8
(8) Nehlat Zion I 67 5,591 83.S
(9) Nahlat Ahim 77 5,915 76.8
(10) Old City 30 2,571 85.7
Total 51,660 50.7
147. The population figures given in table 10 are based on a census which was conducted in 1939 by Dr. Gurewitch, the Jewish Agency statistician, and which gave the total Jewish population of Jerusalem as 80,000; to this figure a 25% increase in the past seven years is added making a total of 100,000. Of this total roughly 52% are living in the areas mentioned above. While many parts of the areas cannot properly be classified as slums it is
692