| Prev | Next |  |
| Prev | Next |
| PalestineRemembered | About Us | Oral History | العربية | |
| Pictures | Zionist FAQs | Haavara | Maps | |
| Search |
| Camps |
| Districts |
| Acre |
| Baysan |
| Beersheba |
| Bethlehem |
| Gaza |
| Haifa |
| Hebron |
| Jaffa |
| Jericho |
| Jerusalem |
| Jinin |
| Nablus |
| Nazareth |
| Ramallah |
| al-Ramla |
| Safad |
| Tiberias |
| Tulkarm |
| Donate |
| Contact |
| Profile |
| Videos |
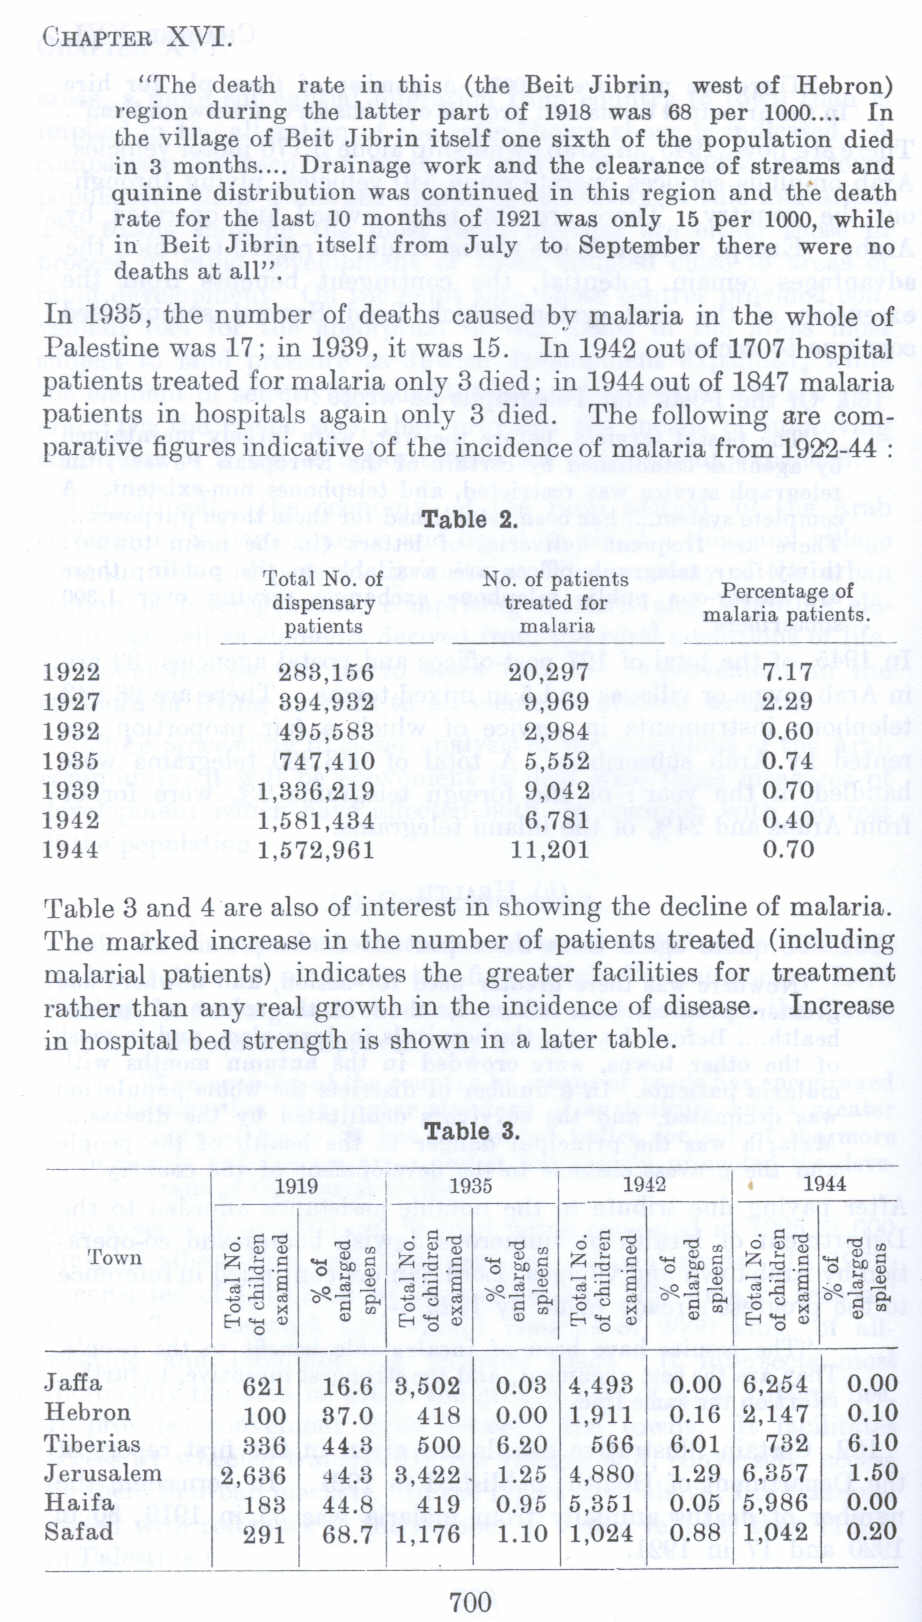
Table 2 showing Incidents of Malaria, 1922 - 1944 in Palestine before 1948 (Nakba), British Mandate: A Survey of Palestine: Volume II - Page 700. Chapter XVI: Social Services : Section 5: The Standard of Living of Palestinian Arabs : |
Disclaimer
The above documents, article, interviews, movies, podcasts, or stories reflects solely the research and opinions of its authors. PalestineRemembered.com makes its best effort to validate its contents.


Post Your Comment
*It should be NOTED that your email address won't be shared, and all communications between members will be routed via the website's mail server.
“The death rate in this (the Beit Jibrin, west of Hebron) region dur.ing the latter part of 1918 was 68 per 1000.... In the village of Beit Jibrin itself one sixth of the population died in 3 months .... Drainage work and the clearance of streams and quinine distribution was continued in this region and the death rate for the last 10 months of 1921 was only 15 per 1000, while in Beit Jibrin itse1f from July to September there were no deaths at all".
In 1935, the number of deaths caused by malaria in the whole of Palestine was 17; in 1939, it was 15. In 1942 out of 1707 hospital patients treated for malaria only 3 died; in 1944 out of 1847 malaria patients in hospitals again only 3 died. The following are comparative figures indicative of the incidence of malaria from 1922-44 :
Table 2.
Total No. of No. of patients Percentage of
dispensary treated for malaria patients.
patients malaria.
------
1922 283,156 20,297 7.17
1927 394,932 9,969 2.29
1932 495,583 2,984 0.60
1935 747,410 5,552 0.74
1939 1,336,219 9,042 0.70
1942 1,581,434 6,781 0.40
1944 1,572,961 11,201 0.70
Table 3 and 4 are also of interest in showing the decline of malaria. The marked increase in the number of patients treated (including malarial patients) indicates the greater facilities for treatment rather than any real growth in the incidence of disease. Increase in hospital bed strength is shown in a later table.
Table 3.
1919 1935 1942 1944
Jaffa 621 16.6 S,502 0.03 4,493 0.00 6,254 0.00
Hebron 100 87.0 418 0.00 1,911 0.16 2,147 0.10
Tiberi as 336 44.3 500 6.20 566 6.01 732 6.10
Jerusalem 2,636 44.3 3,422 1.25 4,880 1.29 6,357 1.50
Haifa. 183 44.8 419 0.95 5,351 0.05 5,986 0.00
Salad 291 68.7 1,176 1.10 1,024 0.88 1,042 0.20
Page 700