| Prev | Next |  |
| Prev | Next |
| PalestineRemembered | About Us | Oral History | العربية | |
| Pictures | Zionist FAQs | Haavara | Maps | |
| Search |
| Camps |
| Districts |
| Acre |
| Baysan |
| Beersheba |
| Bethlehem |
| Gaza |
| Haifa |
| Hebron |
| Jaffa |
| Jericho |
| Jerusalem |
| Jinin |
| Nablus |
| Nazareth |
| Ramallah |
| al-Ramla |
| Safad |
| Tiberias |
| Tulkarm |
| Donate |
| Contact |
| Profile |
| Videos |
Employment and Unemployment in Palestine before Nakba: Estimate of Jews Gainfully Employed-1945 in Palestine before 1948 (Nakba), British Mandate: A Survey of Palestine: Volume II - Page 732. Section 1: |
Disclaimer
The above documents, article, interviews, movies, podcasts, or stories reflects solely the research and opinions of its authors. PalestineRemembered.com makes its best effort to validate its contents.


Post Your Comment
*It should be NOTED that your email address won't be shared, and all communications between members will be routed via the website's mail server.
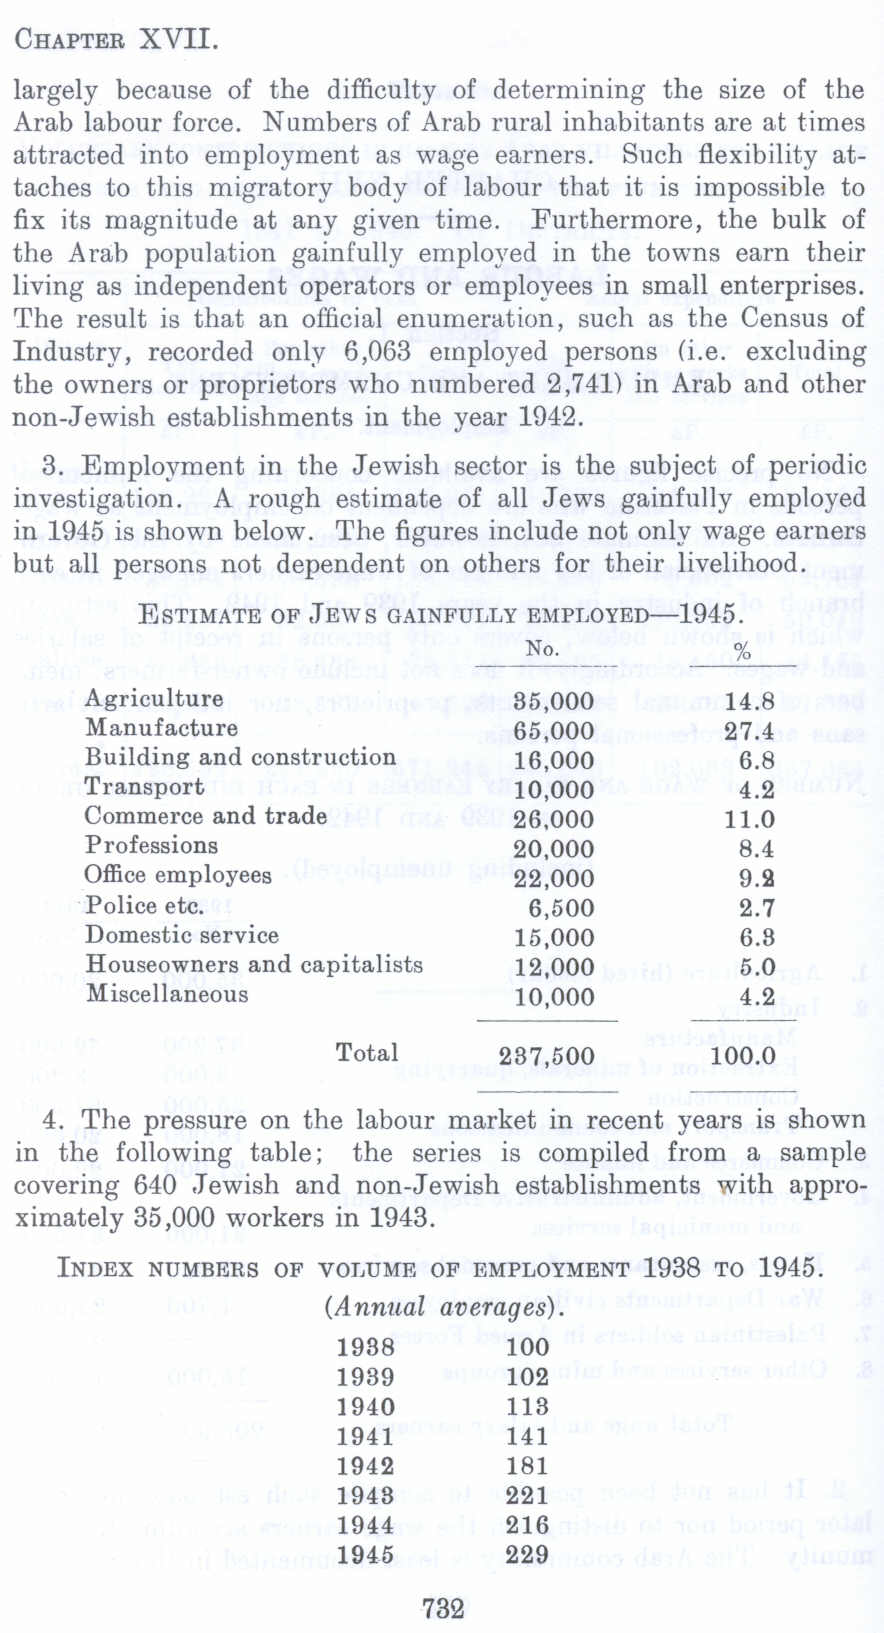
largely because of The difficulty of determining the size of the Arab labour force. Numbers of Arab rural inhabitants are at times attracted into employment as wage earners. Such flexibility attaches to this migratory body of labour that it is impossible to fix its magnitude at any given time. Furthermore, the bulk of the Arab population gainfully employed in the towns earn their living as independent operators or employees in small enterprises. The result is that an official enumeration, such as the Census of Industry, recorded only 6,063 employed persons (i.e. excluding the owners or proprietors who numbered 2,741) in Arab and other non-Jewish establishments in the year Hl42.
3. Employment in the Jewish sector is the subject of periodic investigation. A rough estimate of all Jews gainfully employed in 1945 is shown below. The figures include not only wage earners but all persons not dependent on others for their livelihood.
ESTIMATE OF ,JEWS GAINFULLY EMPLOYED--1945.
No. __ %_
-------
Agriculture 35,000 14.8
Manufacture 65,000 27.4
Building and construction 16,000 6.8
Transport 10,000 4.2
Commerce and trade 26,000 11.0
Professions 20,000 8.4
Office employees 22,000 9.S
Police etc. 6,500 2.7
Domestic service 15,000 6.3
Houseowners and capitalists 12,000 5.0
Miscellaneous 10,000 4.2
Total 237,500 100.0
4. The pressure on the labour market in recent years is shown in the following table; the series is compiled from a sample covering 640 Jewish and non-Jewish establishments with approximately 35 ,000 workers in 1943.
INDEX NUMBERS OF VOLUME OF EMPLOYMENT 1938 TO 1945.
(Annual averages).
1988 100
1989 102
1940 118
1941 141
1942 181
1948 221
1944 216
1945 229
Page 732