| Prev | Next |  |
| Prev | Next |
| PalestineRemembered | About Us | Oral History | العربية | |
| Pictures | Zionist FAQs | Haavara | Maps | |
| Search |
| Camps |
| Districts |
| Acre |
| Baysan |
| Beersheba |
| Bethlehem |
| Gaza |
| Haifa |
| Hebron |
| Jaffa |
| Jericho |
| Jerusalem |
| Jinin |
| Nablus |
| Nazareth |
| Ramallah |
| al-Ramla |
| Safad |
| Tiberias |
| Tulkarm |
| Donate |
| Contact |
| Profile |
| Videos |
British Mandate: A Survey of Palestine: Volume II - Page 801 |
Disclaimer
The above documents, article, interviews, movies, podcasts, or stories reflects solely the research and opinions of its authors. PalestineRemembered.com makes its best effort to validate its contents.


Post Your Comment
*It should be NOTED that your email address won't be shared, and all communications between members will be routed via the website's mail server.
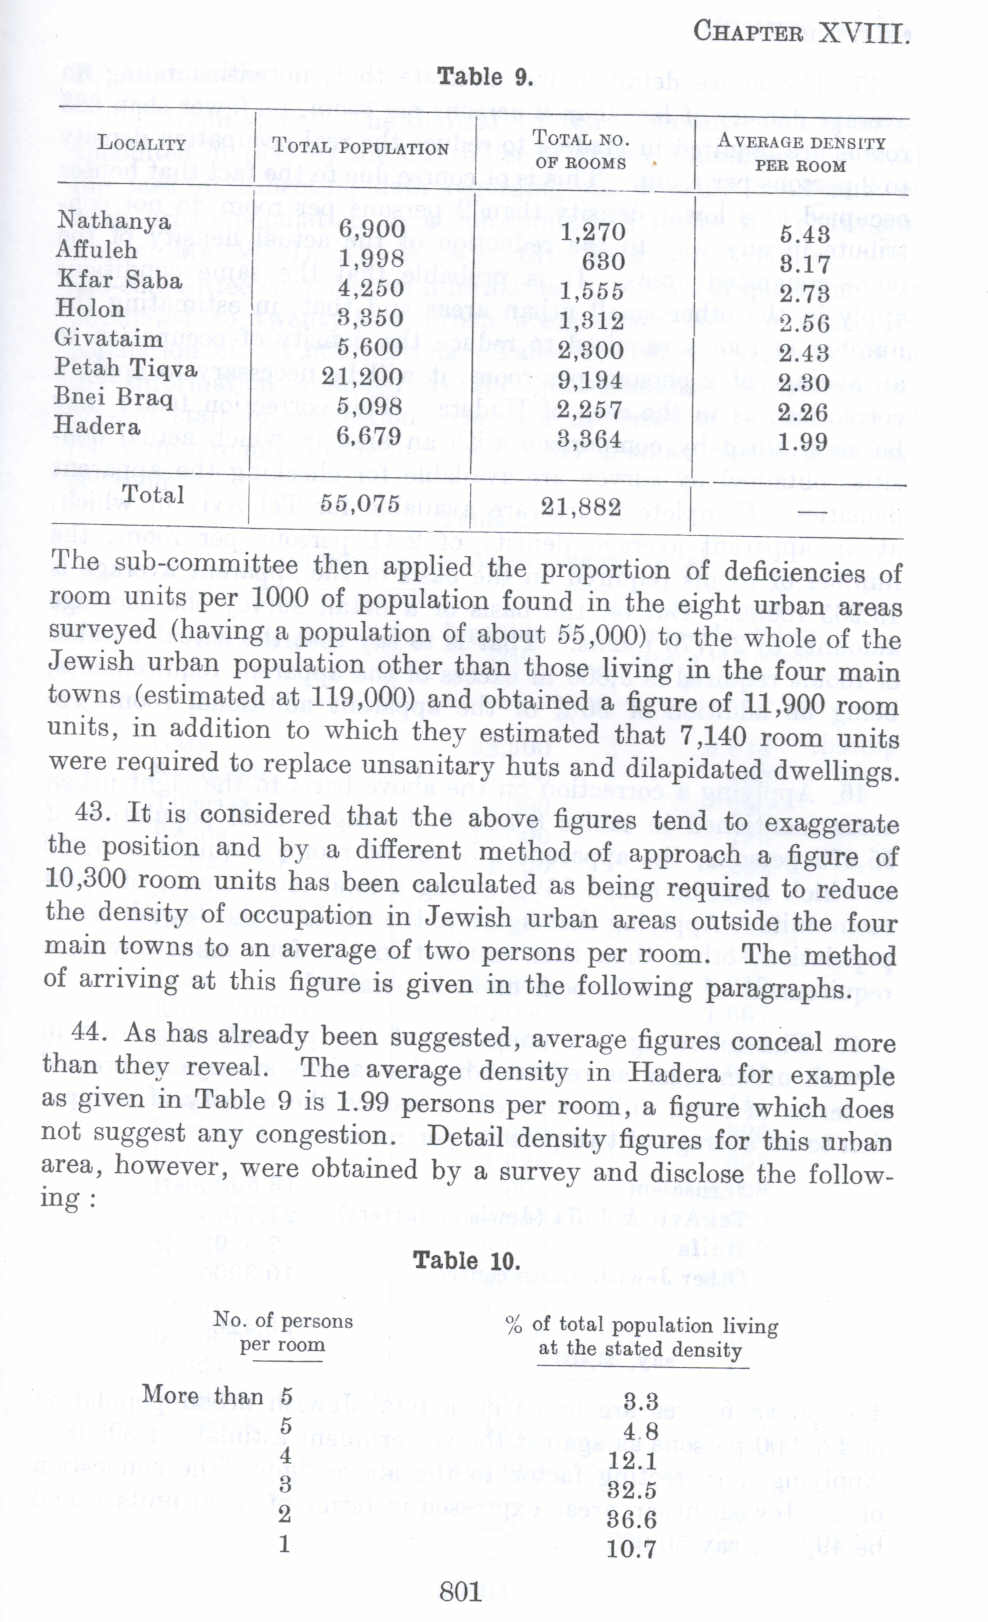
Table 9.
TOTAL POPULATWN I TOTAL NO. AVERAGE DENSITY
LOCALITY OF ROOMS PER ROOM
Nathanya I 6,900 1,270 I 5.43
Afluleh 1,998 630 3.17
Kfar Saba. 4,250 1,555 2.73
Rolon 3,350 1,312 2.56
Givataim 5,600 2,300 2.43
Petah Tiqva. 21,200 9,194 2.30
Bnci Braq 5,098 2,257 2.26
Hader a 6.679 3,364 1.99
Total 55,075 I 21,882
The sub-committee then applied the proportion of deficiencies of room units per 1000 of population found in the eight urban areas surveyed (having a population of about 55 ,000) to the whole of the Jewish urban population other than those living in the four main towns (estimated at 119,000) and obtained a figure of 11,900 room units, in addition to which they estimated that 7 ,140 room units were required to replace unsanitary huts and dilapidated dwellings.
43. It is considered that the above figures tend to exaggerate the position and by a different method of approach a figure of 10,300 room units has been calculated as being required to reduce the density of occupation in Jewish urban areas outside the four main towns to an average of two persons per room. The method of arriving at this figure is given in the following paragraphs.
44. As has already been suggested, average figures conceal more than they reveal. The average density in Hadera for example as given in Table 9 is 1.99 persons per room, a figure which does not suggest any congestion. Detail density figures for this urban area, however, were obtained by a survey and disclose the following:
Table 10.
No. o( persons per room
% of total population living at the stated density
More than 5 5 4 3 2
3.3 4 8 12.1 32.5 36.6 10.7
801