| Prev | Next |  |
| Prev | Next |
| PalestineRemembered | About Us | Oral History | العربية | |
| Pictures | Zionist FAQs | Haavara | Maps | |
| Search |
| Camps |
| Districts |
| Acre |
| Baysan |
| Beersheba |
| Bethlehem |
| Gaza |
| Haifa |
| Hebron |
| Jaffa |
| Jericho |
| Jerusalem |
| Jinin |
| Nablus |
| Nazareth |
| Ramallah |
| al-Ramla |
| Safad |
| Tiberias |
| Tulkarm |
| Donate |
| Contact |
| Profile |
| Videos |
British Mandate: A Survey of Palestine: Volume II - Page 828 |
Disclaimer
The above documents, article, interviews, movies, podcasts, or stories reflects solely the research and opinions of its authors. PalestineRemembered.com makes its best effort to validate its contents.


Post Your Comment
*It should be NOTED that your email address won't be shared, and all communications between members will be routed via the website's mail server.
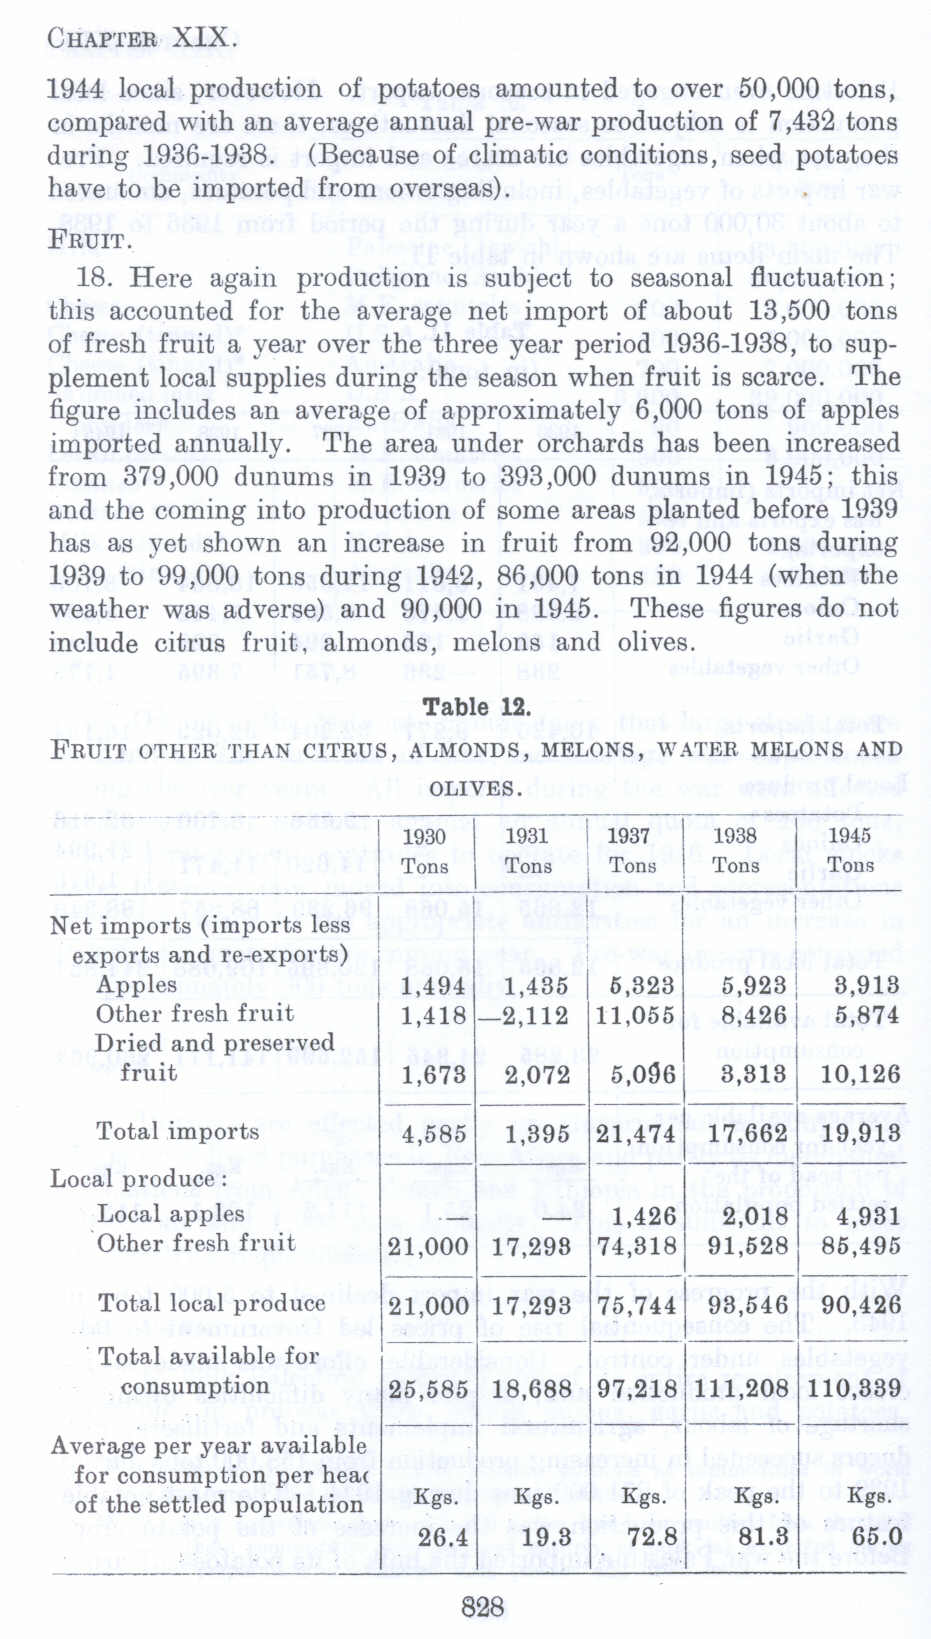
1944 local production of potatoes amounted to over 50,000 tons, compared with an average annual pre-war production of 7 ,432 tons during 1936-1938. (Because of climatic conditions, seed potatoes have to be imported from overseas).
FRUIT.
18. Here again production is subject to seasonal fluctuation; this accounted for the average net import of about 13,500 tons of fresh fruit a year over the three year period 1936-1938, to supplement local supplies during the season when fruit is scarce. The figure includes an average of approximately 6,000 tons of apples imported annually. The area under orchards has been increased from 379 ,000 dunums in 1939 to 393 ,000 dunums in 1945; this and the coming into production of some areas planted before Hl39 has as yet shown an increase in fruit from 92,000 tons during 1939 to 99,000 tons during 1942, 86,000 tons in 1944 (when the weather was adverse) and 90 ,000 in 1945. These figures do not include citrus fruit, almonds, melons and olives.
Table 12.
FRUIT OTHER THAN Citrus, ALMONDS, MELONS, WATER MELONS AND OLIVES.
Net imports (imports less
exports and re-exports) Apples
Other fresh fruit Dried and preserved
fruit
Total imports Local produce:
Local apples "Other fresh fruit
Total local produce
Total available for consumption
Average per year available for consumption per hear of the settled population
1,494 I 1,435 I 5.323 1,418 -2,112 11,055
1,673 I 2,012 I 5,096 I 3,318 I 10,126
1937 Tons
1038 Tons
1945 Tons
5,928 I 8,426
S,918 5,874
-11930 I 1931
____ Tons Tons 11
4,5851 1,895 121,4741 17,662 19,918
----=--=- 1,4261--::-:::
21,000 17,298 74,818 91,528 85,496
21,000 17,293 75,7441' 93,546 90,426
25,585 18,688 97,2181111,2081110,839
-- -------------
Kge. 1• Kg*. I Kg*•I Kga. I Kga.
26.4 19.8 72.8 81.8 65.0
828